

Overview
The Dashboard Overview provides a consolidated summary of transaction activity for the selected merchant, presenting analytical information through graphical and tabular representations.
The Dashboard is designed to provide users with an immediate view of transaction performance and payment activity, enabling operational monitoring without requiring navigation through individual transaction lists.
The information displayed within the Dashboard reflects the transaction data available for the selected merchant and analytical criteria.
Dashboard Summary
When users access the Dashboard, the displayed information provides a high-level overview of transaction activity for the selected merchant.
The Dashboard combines summary information with graphical representations, allowing users to quickly identify transaction trends and monitor payment activity.
Depending on the selected analytical criteria, the Dashboard can present transaction information using different groupings and visualization formats to support operational monitoring and business analysis.
The Dashboard information displayed to each user depends on:
- The authenticated user’s assigned permissions.
- The selected merchant.
- The services enabled for the merchant.
- The analytical criteria currently applied.
Automatic Data Update
The Dashboard information is refreshed automatically by the SIBS Backoffice platform.
The Last Update indicator displays the date and time when the Dashboard information was most recently refreshed, allowing users to verify the freshness of the displayed analytical information.
The refresh process is performed automatically by the platform and does not require user intervention.
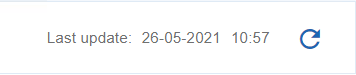
Figure 1 – Automatic data update feature
Understanding the Dashboard
The Dashboard provides an interactive analytical workspace that allows users to review transaction information using different analytical perspectives.
The displayed information can be refined using Dashboard filters, advanced search capabilities, analytical categories, and different visualization modes.
These features enable users to analyse transaction information according to their operational and business requirements.
The following sections of this chapter describe each of these Dashboard capabilities in detail.
Next Steps
After becoming familiar with the Dashboard Overview, users can continue exploring the available analytical capabilities through the following sections:
- G.1.3.2 – Dashboard Filters, describing how to refine the information displayed within the Dashboard.
- G.1.3.3 – Dashboard Search, describing how to locate Dashboard information for specific Stores and Terminals.
- G.1.3.4 – Dashboard Data Categories, describing the available analytical groupings.
- G.1.3.5 – Dashboard Visualizations, describing the available graphical representations and visualization modes.