

Overview
Dashboard Data Categories determine how transaction information is grouped, organised, and presented within the Dashboard.
By selecting a different data category, users can analyse the same transaction information from different business perspectives without changing the underlying transaction data.
The Dashboard supports the following analytical data categories:
- Total
- Channels
- Terminals
- Systems
- Methods
Each category provides a different analytical perspective on the selected transaction information. While the Total category presents aggregated transaction information, the remaining categories group the same data according to specific business dimensions.
Selecting a Data Category
The Data Category selector allows users to choose the analytical grouping used to display Dashboard information.
After selecting a different category, the Dashboard updates automatically and refreshes all graphical representations using the selected analytical perspective.
The process for selecting a data category is described in G.1.3.2 – Dashboard Filters.

Figure 1 – Filter by data category
Total
The Total category displays the complete set of transactions available within the selected Dashboard criteria.
Selecting one of the available categories within the displayed graph presents the corresponding detailed information for the selected category.
For example, when the Methods category is selected and the Card option is chosen, the graph displays only the transaction information related to that payment method.
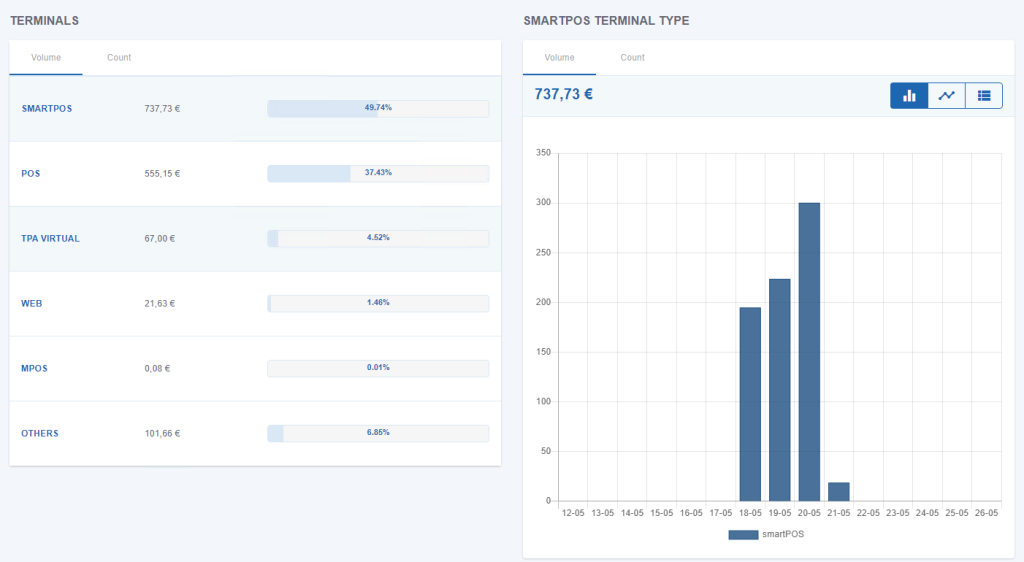
Figure 2 – Example of “Total” graph
Channels
The Channels category groups transaction information according to the payment channels used to process transactions.
Channels represent the payment gateways through which transactions are processed, whether physical or digital.
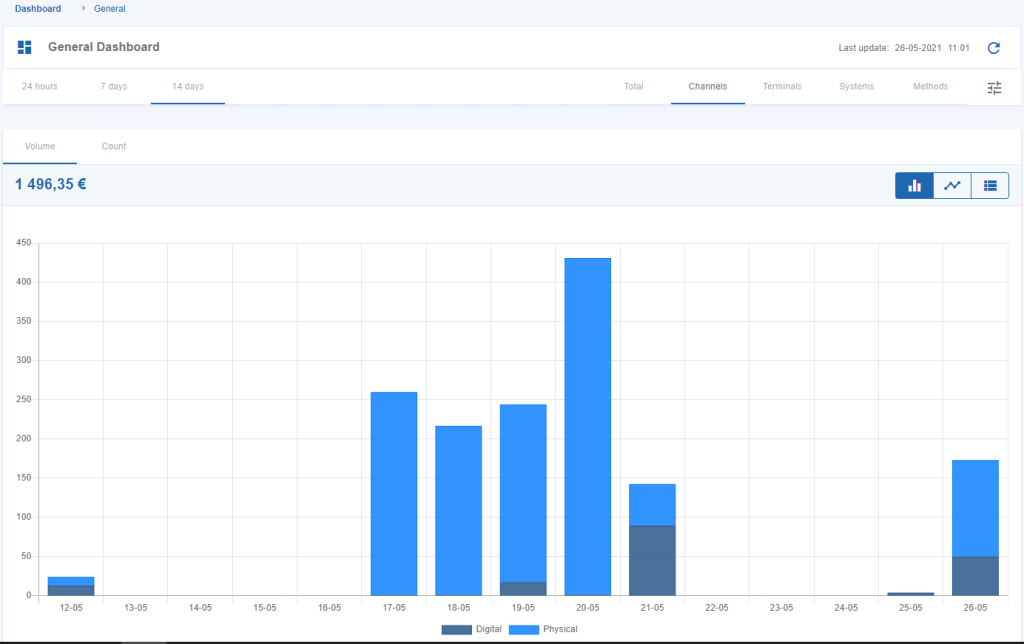
Figure 3 – “per Channel” graphical data
Terminals
The Terminals category groups transaction information according to the payment equipment or payment interface used to process transactions.
Examples include:
- POS – traditional Point-of-Sale terminal.
- mPOS – mobile Point-of-Sale terminal.
The Dashboard displays a maximum of seven financial products. Any terminal that does not belong to the categories POS, Web, mPOS, SIBS Backoffice, or SmartPOS is grouped under Others.
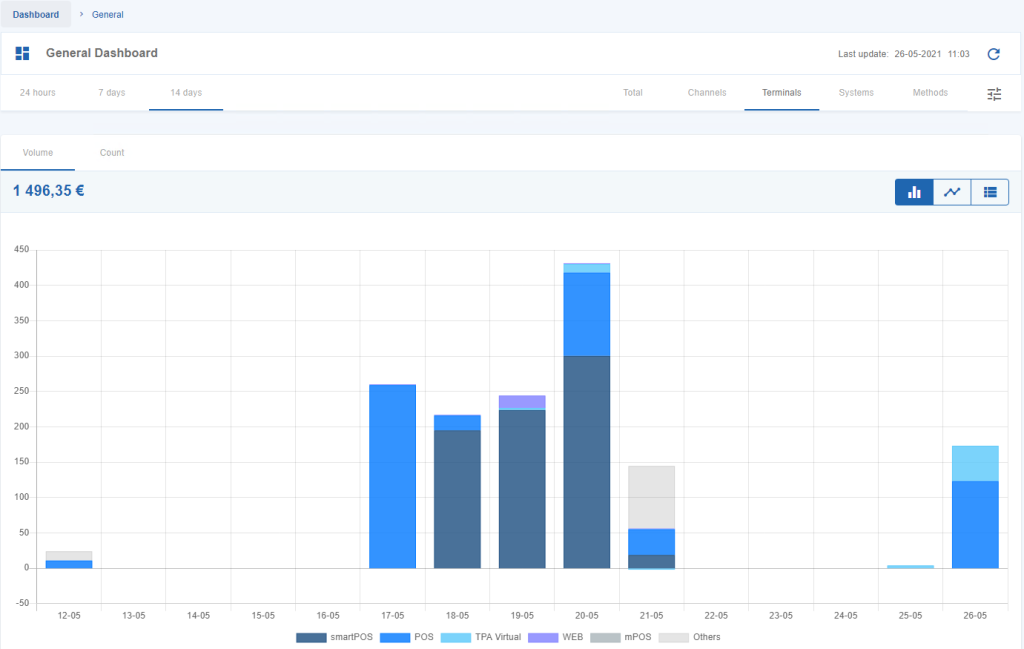
Figure 4 – “per Terminal” graphical data
Systems
The Systems category groups transaction information according to the international payment schemes associated with card transactions.
Examples include:
- Visa
- Mastercard
The Dashboard displays a maximum of seven financial products, sorted according to the selected analytical view (Volume or Count). Any additional systems are grouped under Others.
The MULTIBANCO element is displayed only when the Count view is selected and takes priority over the remaining systems.
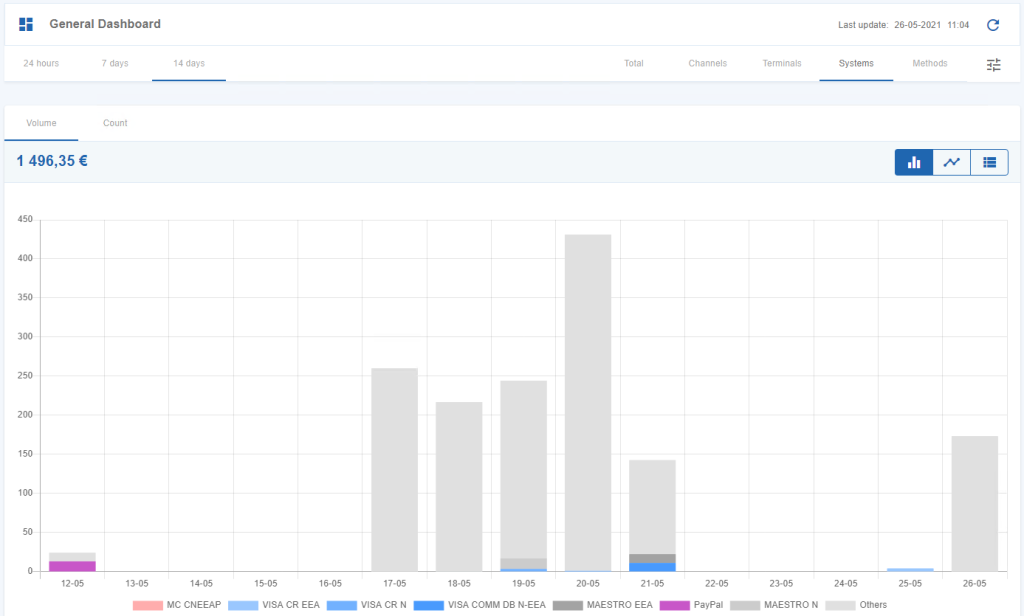
Figure 5 – “per System” graphical data
Methods
The Methods category groups transaction information according to the payment method used to complete the transaction.
Examples include:
- MULTIBANCO Reference
- Cards
- MB WAY
The Dashboard displays a maximum of seven financial products. Payment methods other than Cards, MB WAY, MULTIBANCO Reference, and PayPal are grouped under Others.
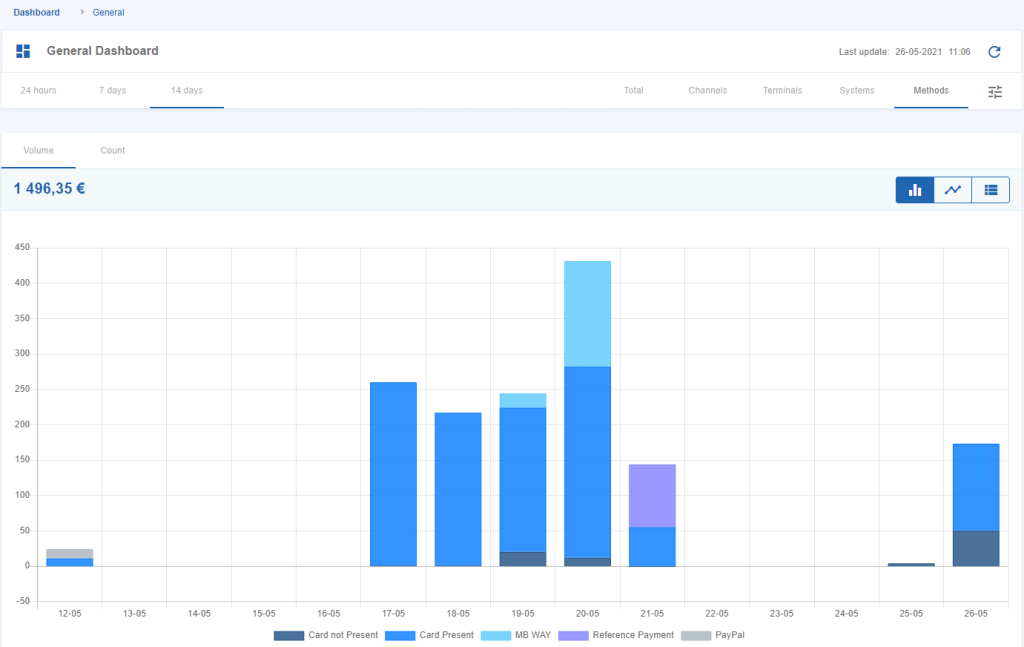
Figure 6 – “per Method” graphical data