

Overview
Dashboard Filters allow users to refine the information displayed within the Dashboard, enabling transaction data to be analysed according to predefined time periods and analytical criteria.
By applying Dashboard Filters, users can focus on specific time ranges and analytical views, making it easier to monitor transaction activity and evaluate payment performance.
The selected filters affect the information displayed throughout the Dashboard and are applied to all graphical and summary information presented on the page.
Filtering Dashboard Information
The Dashboard provides filtering options that allow users to refine the analytical information displayed without leaving the Dashboard.
Users can refine the displayed information by selecting:
- A predefined time period.
- An analytical data category.
These filtering options update the Dashboard to display the corresponding transaction information.
Default Time Period
The Dashboard includes predefined time periods that allow users to quickly analyse recent transaction activity.
The available predefined time periods are:
- Last 24 Hours
- Last 7 Days
- Last 14 Days
To select a predefined time period:
Step 1. Open the Dashboard.
Step 2. Locate the Time Period filter.
Step 3. Select the desired predefined time period.
The Dashboard refreshes automatically to display the corresponding transaction information.
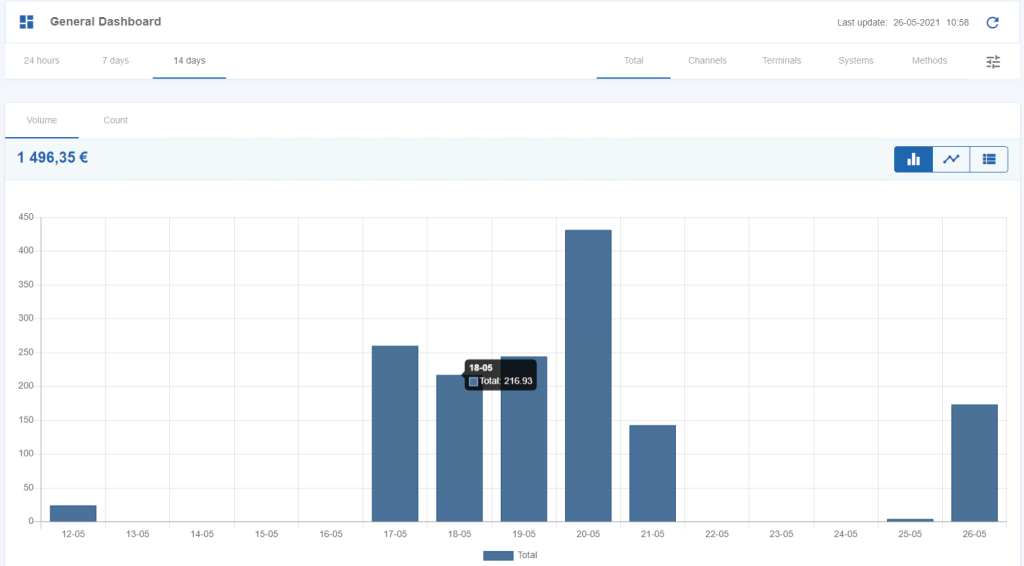
Figure 1 – Filter by a default time period
Data Category Selector
The Data Category selector allows users to change the analytical grouping used to display Dashboard information.
Selecting a different data category updates the Dashboard to present the same transaction information grouped according to the selected analytical perspective.
The available Dashboard data categories are described in G.1.3.4 – Dashboard Data Categories.
To change the displayed data category:
Step 1. Locate the Data Category selector.
Step 2. Select the desired analytical category.
The Dashboard refreshes automatically to display the selected analytical view.

Figure 2 – Data Category selector
Applying Dashboard Filters
Dashboard filters can be used together to refine the analytical information displayed.
For example, users may combine:
- A predefined time period.
- A selected data category.
The Dashboard updates automatically whenever a filter selection is changed, allowing users to compare transaction information using different analytical perspectives.